California Bike Lanes and Bicycle Infrastructure Explained: Why Safe Bikeways Matter
Follow us on
social media!
California leads the nation in cycling participation, yet its roads remain the most dangerous for riders. In 2023, 145 bicyclists were killed on California roads. Expanding protected bike lanes and redesigning high-injury corridors save lives, but progress varies by city and region.
California’s approach to bike lanes and bicycle infrastructure ranges from fully protected bike lanes to dangerous shared traffic lanes. Understanding the many types of California bikeways helps riders understand their safety levels and supports advocacy for better infrastructure.
Table Of Contents
Why Bicycle Infrastructure Is Important
Safe and well-designed bikeways and bicycle infrastructure transform how people move, connect, and stay healthy. According to research from the National Institute for Transportation and Communities (NITC), protected bike lanes can increase ridership by 75% compared to standard painted lanes.
To learn more about the different types of bikeways and their safety levels, see Types of Bike Lanes and Bikeways: Complete Guide to Bicycle Infrastructure.
Beyond safety, quality bicycle infrastructure provides wide-reaching community benefits:
- Public Health: Regular cycling improves cardiovascular health, reduces obesity, and encourages active lifestyles.
- Environment: Replacing even one daily car trip with a bike ride can cut personal transportation emissions by roughly
67%, helping clean the air and reduce greenhouse gas emissions.
- Equity: Safe, connected bike routes give lower-income and car-free households an affordable, reliable way to travel for work, school, and daily needs.
Infrastructure improvements also make streets safer for everyone. Studies show that adding bike lanes can reduce total crashes by up to 49% on urban four-lane undivided roads and by 30% on two-lane undivided roads.
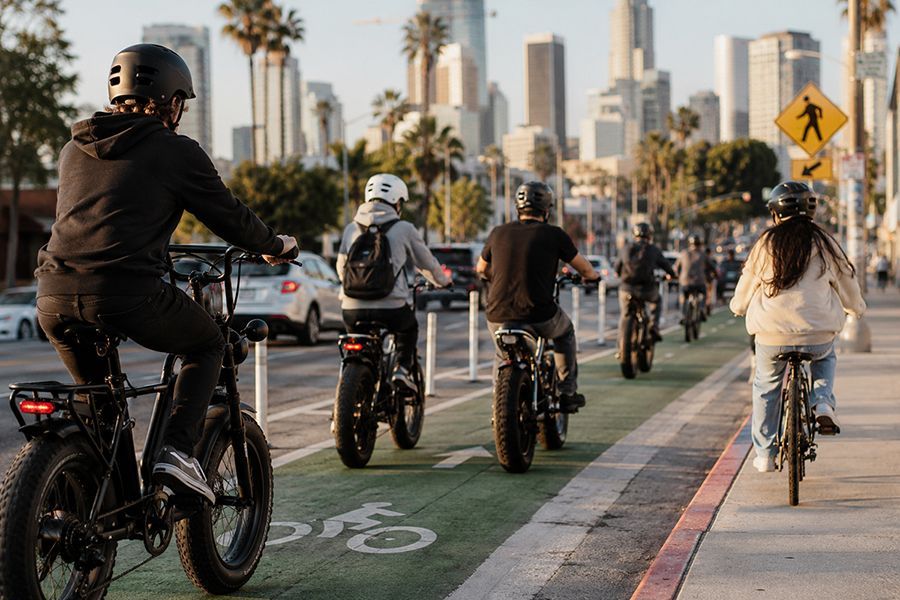
Finally, the rapid growth of electric bicycles (e-bikes) has intensified the need for separated, protected facilities. U.S. e-bike sales reached 1.1 million units in 2022, nearly quadrupling since 2019—a clear signal that modern infrastructure must adapt to accommodate faster, higher-volume bicycle traffic safely.
The Dangers of Inadequate Bicycle Infrastructure
Poorly designed or incomplete bicycle infrastructure continues to contribute to severe and fatal crashes across California. Most collisions occur in busy urban environments where cyclists share lanes with fast-moving vehicles and limited protection.
According to UC Berkeley SafeTREC data:
- 88% of fatal bicycle crashes occurred on
urban roads, compared to
12% on rural roads.
- Minor arterials—typically multi-lane city streets with high traffic volumes- were the most common location, accounting for 37% of all fatal bicycle crashes.
California Bicycle Accident Causes and Statistics
Data from UC Berkeley SafeTREC and the California Highway Patrol’s SWITRS database highlight the human cost of inadequate infrastructure:
- 2022: 177 bicyclist deaths statewide
- 2023: 145 bicyclist deaths (−20.8% from 2022)
The most frequent crash types and contributing factors in fatal or serious-injury (FSI) collisions include:
- Broadside (T-bone) crashes: 33.2% of all FSI bicycle crashes in 2022
- Other/unspecified collisions: 22.3%
- Rear-end crashes: 11.2%
- Sideswipe collisions: 9.3%
- Head-on crashes: 7.3%
These figures demonstrate that many of California’s most severe bicycle crashes happen where there are no separated lanes and high vehicle speeds, reinforcing the urgent need for protected bikeways and safer intersection design.
Understanding the most common dangers of cycling on the road becomes crucial for navigating these challenging environments.
Related Articles:
- 20 Types of Bicycle Accidents & Prevention Tips
- Can You Ride a Bicycle On the Highway
- California Bicycle Laws and Accident Statistics
California’s Four Bikeway Classes
California recognizes four distinct bikeway classifications, each offering varying levels of safety and separation from motor vehicle traffic.
Class III – Bike Routes/Shared Lanes
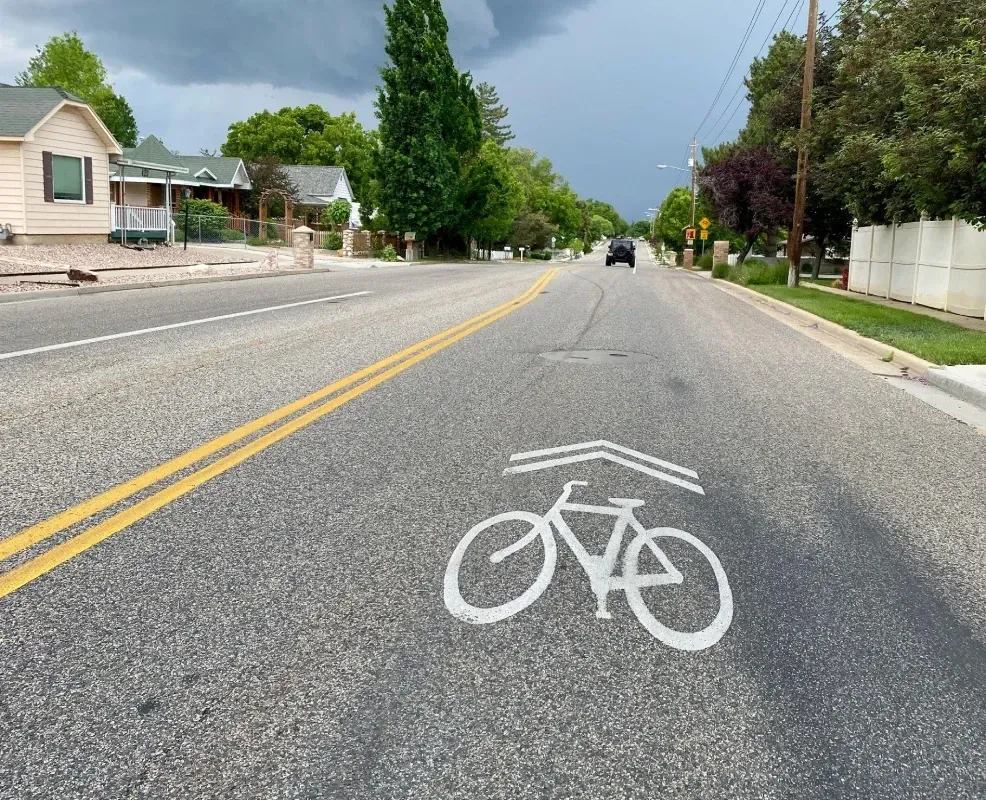
Class III bikeways are shared roadways integrated with regular traffic flow, using signage and pavement markings (sharrows) but providing no physical separation from vehicles.
Research finds mixed safety outcomes for sharrows and emphasizes that they are primarily a wayfinding/route-continuity treatment rather than a protection measure.
Class II – Painted Bike Lanes
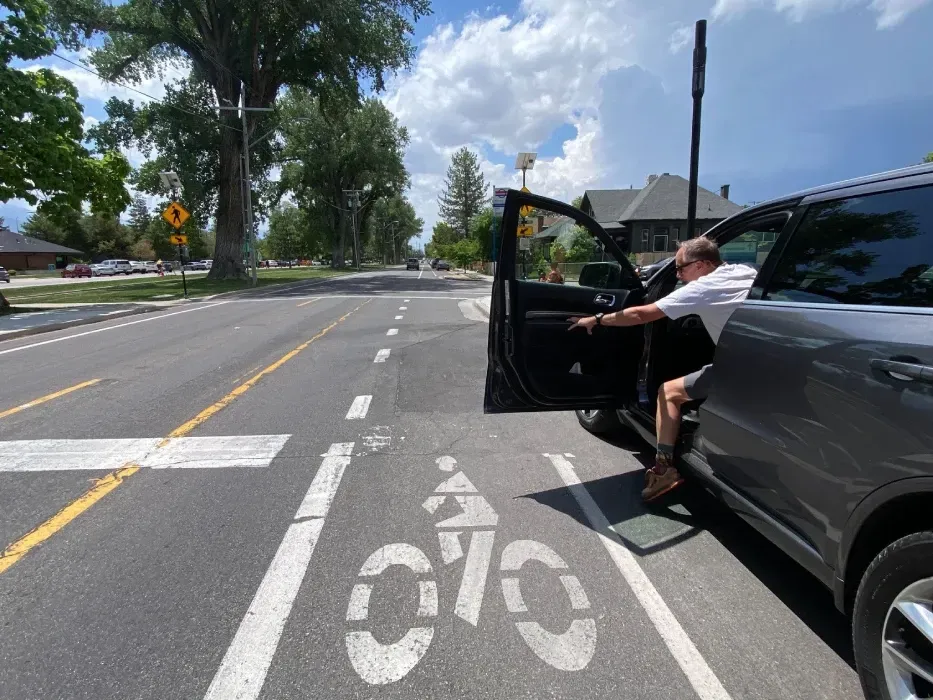
Class II bike lanes are on-street facilities delineated with painted stripes (typically ~4–6 ft wide) and offer no physical protection from vehicles. They improve predictability but leave riders exposed to traffic and door zones.
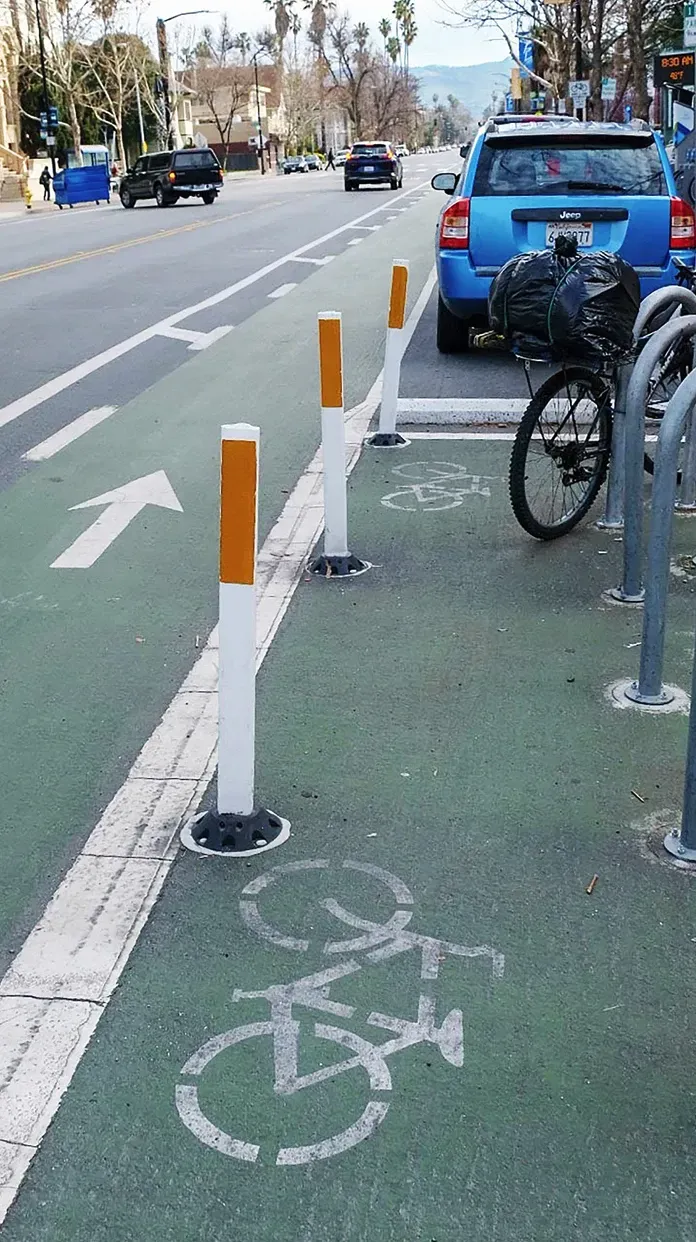
Class IV – Protected Bike Lanes with Barriers
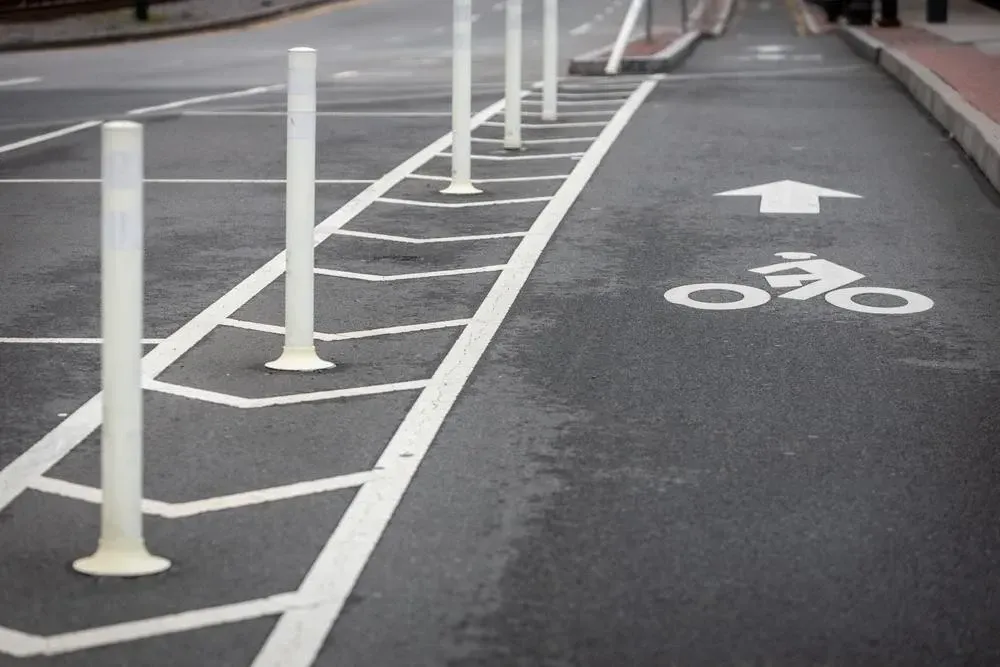
Class IV separated bikeways provide exclusive space for bicycles using physical barriers such as curbs, bollards, or parked cars. Studies show 44% fewer injuries than painted lanes and 75% higher ridership due to a much higher level of safety.
Examples include Telegraph Avenue in Oakland, Venice Boulevard in Los Angeles, and the Elenda Bikeway in Culver City.
Class I – Off-Street Paths, Cycle Tracks, and Multi-Use Trails
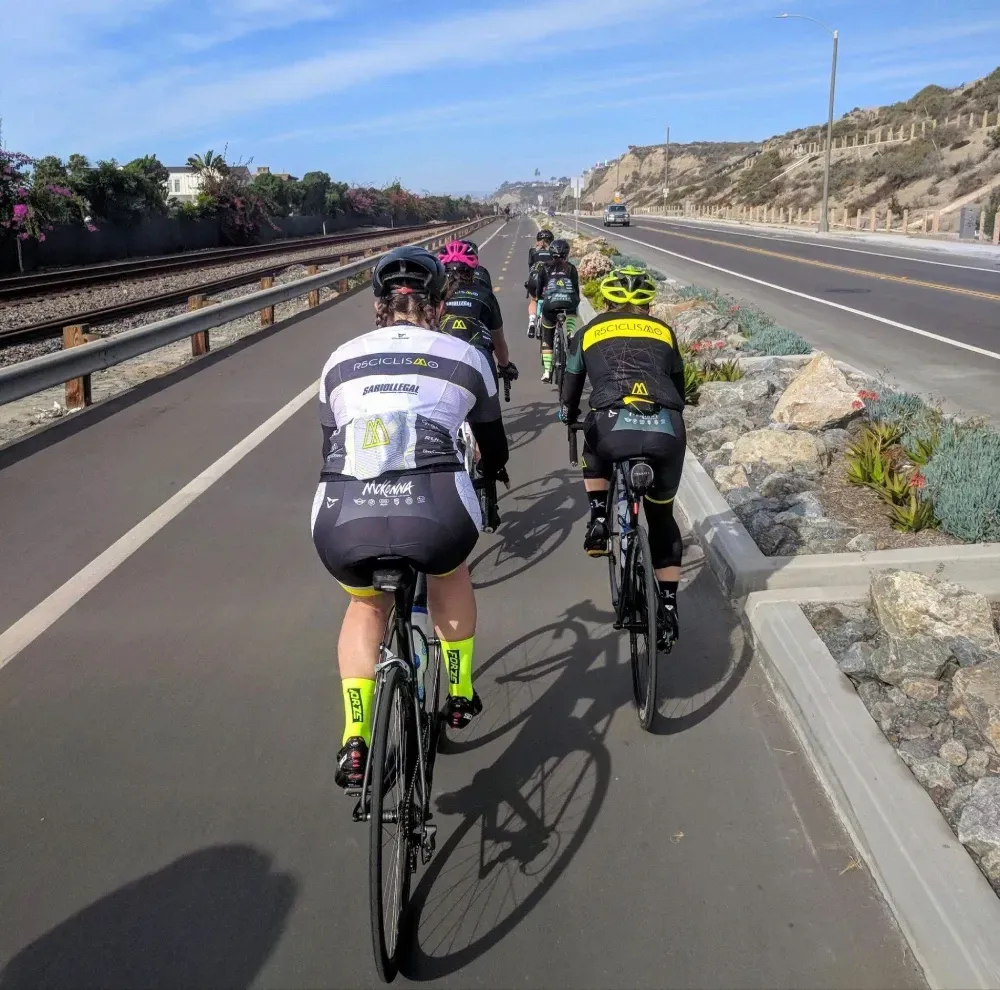
Class I bike paths are fully separated from motor vehicle traffic (often along rivers, canals, or dedicated rights-of-way) and may be shared with pedestrians and other non-motorized users. They are designed as exclusive bicycle facilities off the road and away from vehicular traffic.
Notable examples include the Coyote Creek Trail (San Jose), Ballona Creek Bike Path (Los Angeles), and American River Parkway (Sacramento).
Related Articles:
- What to Expect When You Are Expecting a Bikeway
- Bicycle Etiquette Guide: Essential Rules and Safety Tips for Cyclists
Why Protected Bike Lanes Are the Safest
Protected lanes eliminate the most dangerous conflicts on California roads, including side-swipes, right hooks, and dooring. By physically separating cyclists from moving traffic,
protected bikeways reduce crash risk up to 90% compared to no bicycle infrastructure.
Studies show that safe bicycle infrastructure directly influences ridership. About
60% of the population is “interested but concerned” about biking, and
80% of those say they would only feel comfortable cycling on streets with separated or protected bike lanes. This means building protected bikeway facilities isn’t just about safety; it’s key to encouraging more people to ride.
According to the NACTO Urban Bikeway Design Guide and the Protected Bike Lanes Study, upgrading a traditional class II bike lane to a class IV protected bike lane can reduce motor vehicle–bicycle crashes by more than 50%.
Further evidence from PeopleForBikes confirms that cities with protected bike lanes experience 44% fewer fatalities for all road users and 50% fewer serious injuries. Together, these findings demonstrate that protected bike lanes make streets safer not just for cyclists, but for everyone.
Overall, these statistics clearly show that expanding protected bike lanes in California is one of the most effective strategies for preventing serious crashes, reducing fatalities, and building safer, more connected communities.
California also has a 3-Feet Passing Law, which requires motorists to give cyclists at least three feet of clearance when overtaking. The more recent OmniBike Bill (AB 1909) strengthened this rule, requiring drivers to change lanes entirely when passing a bicycle when possible.
Unfortunately, many motorists disregard these safety laws, and enforcement remains rare. Protected bikeways remove this uncertainty for drivers and create a safer, more predictable environment for everyone sharing the road.
California High Injury Network Areas for Cyclists
The majority of California’s bicycle crashes occur on a small number of high-traffic streets that typically lack protected bike lanes or safe bicycle infrastructure. The California High-Injury Network (HIN) identifies corridors where the most severe crashes occur.
Los Angeles County
Los Angeles County leads the state with over 2,000 bicycle crashes each year, many of which are hit and run. The most dangerous corridors include Venice Boulevard (before protection), Crenshaw Boulevard, Sunset Boulevard, and Western Avenue—many of which fall within the city’s High-Injury Network (HIN).
According to Los Angeles Vision Zero, 79.4% of all bicycle KSI (killed or severely injured) collisions occur on just 6.6% of the city’s street network, about 484 miles of roadway, where crashes are most likely to cause serious harm. These corridors are typically multi-lane arterials with speeds over 35 mph and no protected bike lanes.
Orange County
Orange County reports nearly 900 bicycle crashes annually, with high-risk corridors including Beach Boulevard, Pacific Coast Highway (PCH), Harbor Boulevard, El Toro Road, and Katella Avenue near Disneyland.
San Diego County
San Diego County sees about 800 crashes per year, primarily in the dense urban core along University Avenue, El Cajon Boulevard, and Imperial Avenue.
San Francisco
San Francisco’s High-Injury Network covers just 12% of streets yet accounts for 68% of severe and fatal crashes, according to the city’s Vision Zero program. The most hazardous routes include Market, Valencia, Polk, 7th, and Folsom Streets, all key bicycle commuting corridors.
Central Valley
In the Central Valley, cities like Fresno, Bakersfield, and Stockton continue to face major infrastructure gaps despite growing ridership and poor air quality, conditions that safer bicycle networks could help improve.
Explore the policy and culture behind sharing the road in The Bicycle Lane Debate: Should Motorists Share the Road?
Knowing
what to Do After a Bicycle Accident is vital for your safety and legal protection.
What California Cities Are Doing to Improve Bike Lanes
California cities are implementing innovative policies to accelerate bicycle infrastructure development through Vision Zero commitments and comprehensive planning initiatives.
Los Angeles
Los Angeles Vision Zero aims to eliminate traffic deaths, including those involving cyclists, through safer street design and infrastructure investment. Under the city’s Mobility Plan 2035, Los Angeles envisions a connected network of 1,680 miles of bikeways, prioritizing protected bike lanes on high-volume corridors.
The results are beginning to show. The city’s protected bikeway network has grown from 37 miles in 2015 to more than 160 miles by 2024, forming a key part of its Vision Zero rollout. According to LADOT, this expansion has led to a 23% reduction in severe cyclist injuries on protected corridors, demonstrating that well-designed infrastructure directly improves rider safety.
San Francisco
San Francisco Vision Zero uses detailed collision analysis to identify high-risk corridors and prioritize safety improvements. Since Vision Zero launched in 2014, San Francisco has reported a notable decline in bicycle fatalities through targeted, data-driven infrastructure upgrades
San Diego
San Diego is updating its Bicycle Master Plan to align with the city’s Climate Action Plan, which calls for a 10% bicycle mode share for daily trips by 2035. The revised plan focuses on active transportation corridors and expanding protected bike lanes across key urban routes.
One significant step forward is the University Avenue Mobility Project, completed in 2023. The project added continuous protected bike lanes along one of San Diego’s busiest east–west corridors, improving safety and connectivity for cyclists traveling through Hillcrest, North Park, and surrounding neighborhoods. City officials and local advocates view it as a model for future corridor upgrades designed to make cycling in San Diego safer and more accessible.
Common design approach to bicycle infrastructure
Cities increasingly rely on evidence-based design standards from the Federal Highway Administration's Bikeway Selection Guide, considering traffic volumes, speeds, cyclist comfort levels, and available right-of-way.
Legislative and Policy Measures Driving Bikeway Change
California's bicycle infrastructure improvements increasingly rely on policies that require or prioritize cyclist safety during street improvements or maintenance. Different jurisdictions have adopted varying approaches to ensure infrastructure development keeps pace with safety needs.
Los Angeles – Measure HLA (2024)
Passed by 65.5% of voters, Measure HLA requires the city to install Mobility Plan 2035 improvements whenever streets are repaved for at least 1/8 mile. It mandates upgrades to bikes, buses, and pedestrian infrastructure and includes a public dashboard and a legal enforcement mechanism.
Learn more about Measure HLA's impact on Los Angeles streets and ongoing implementation challenges.
San Francisco – Complete Streets & Better Streets Policies
SFCTA Complete Streets is embedded in the city code. These policies require bike and pedestrian improvements during repaving, reconstruction, or right-of-way projects. Agencies must comply with Better Streets design standards for every project.
San Diego – Complete Streets Policy (2023)
The updated Complete Streets Council Policy 900-23 prioritizes bicycle improvements in maintenance and resurfacing projects, integrating traffic calming and multimodal safety design into routine work.
Orange County – Active Transportation Programs
While not a legislative mandate, Orange County supports improvements through:
- OC Active Transportation Plan (2023) – roadmap for bike/ped infrastructure in unincorporated areas.
- OCTA Complete Streets Program – funding for city-level projects that enhance safety and connectivity.
- Bicycle Corridor Improvement Program (BCIP) – grants for closing bikeway gaps and improving corridors.
Comparison Table:
| City/County | Policy | Improvement Trigger | Accountability |
|---|---|---|---|
| Los Angeles | Measure HLA (2024) | Repaving ≥1/8 mile | Public dashboard, enforceable |
| San Francisco | Complete Streets & Better Streets | Repaving or reconstruction | Codified policy |
| San Diego | Complete Streets (2023) | Routine maintenance | Council policy |
| Orange County | Active Transportation & OCTA Programs | Funding cycles, master plans | Discretionary |
Barriers to Building Better Bike Lanes in California
Despite growing support, California cities face significant obstacles in developing comprehensive bike networks.
Political Resistance stems from automotive dependency and NIMBY opposition when protected bike lanes require removing parking or reducing vehicle capacity. Business owners frequently oppose changes despite evidence that bike infrastructure increases foot traffic.
Funding limitations and typical costs:
- Paint-only bike lanes created via restriping can be relatively low-cost (often about $5,000–$20,000 per mile, with $5,000–$50,000 per mile cited depending on pavement condition and scope).
- Separated/Protected facilities vary widely with materials and site conditions; documented project costs range from hundreds of thousands to several million dollars per mile. (PBIC compiled separated bikeway projects at ≈$0.54M–$4.29M per mile across contexts.)
- State program cuts: The 2024–25 state budget reduced the prior one-time General Fund augmentation for the Active Transportation Program by $400M, constraining ATP Cycle 7.
Current investment:
Caltrans plans to spend ≈$930 million (2024–2028) on bicycle and pedestrian infrastructure on the state highway system, including ~265 miles of new/improved bike lanes and 1,300+ safety elements by mid-2028 (approved by the California Transportation Commission).
Process & delivery challenges:
Project delivery often requires multi-agency coordination and environmental review; FHWA highlights these as common factors that lengthen timelines and provides toolkits to help accelerate multimodal project delivery
How California Compares to Other States and Countries
- Oregon leads U.S. bicycle infrastructure efforts, with Portland’s 400+ miles of bikeways achieving a 6.8% bicycle commute mode share—the highest among large U.S. cities.
- New York City has rapidly expanded its network to over 1,500 miles of bike lanes since 2007, including ~200 miles of protected lanes added between 2019–2023, fueling record cycling growth.
- Globally, the Netherlands sets the standard with a 27% national cycling mode share, achieved through fully connected networks, protected intersections, and integration with transit.
- Denmark maintains a 97% satisfaction with the cycling conditions in Copenhagen, driven by continuous protected bike lanes and rigorous year-round maintenance to ensure safety in all weather conditions.
Learn what the U.S. top biking cities are doing right in Best Biking Cities in the U.S. 2025: PeopleForBikes Releases New Rankings.
Equity in California's Cycling Infrastructure
Low-income communities often lack safe bikeways despite higher cycling rates for transportation. Areas with median incomes below $50,000 have 40% fewer miles of bike infrastructure per capita.
Cities like Los Angeles and San Francisco now prioritize “communities of concern” in project planning, ensuring equitable distribution of infrastructure funding through California Climate Investments and Active Transportation Program scoring criteria.
How California Cyclists and Residents Can Advocate for Better Bicycle Infrastructure
Cyclists and residents can help accelerate change:
- Contact city council members with specific requests for protected lanes on unsafe corridors.
- Join public comment sessions during transportation and budget hearings.
- Support local ballot measures and funding initiatives.
- Collaborate with advocacy groups like CalBike, BikeLA, San Francisco Bicycle Coalition, or San Diego County Bicycle Coalition.
Public involvement ensures accountability when cities delay promised improvements.
Building Safer Streets for All Californians
California's bicycle infrastructure development reflects broader transportation choices affecting community health, environmental sustainability, and economic vitality. Protected bike lanes save lives while creating more livable communities for all residents.
Every mile of protected bike lane prevents an average of 2.3 serious injuries annually while encouraging more people to choose cycling for transportation. Current momentum from Measure HLA to statewide Complete Streets policies creates opportunities for accelerated safety improvements.
Your voice matters in local infrastructure decisions through city council meetings, ballot measure support, and participation in advocacy groups.
Bike Legal: Representing Injured Cyclists While Advocating for Safer Streets
At Bike Legal, we’re more than bicycle accident attorneys; we’re cyclists advocating for change. Our firm partners with organizations like CalBike to promote better laws and bicycle infrastructure while representing injured riders across California.
As dedicated California bicycle accident attorneys, we bring unmatched expertise in bicycle accident law and a deep understanding of the local cycling community.
We fight for justice and maximum compensation for injured riders while advocating for infrastructure improvements that prevent crashes.
If you’ve been injured in a bicycle accident, call 877-BIKE LEGAL (877-245-3534) for a free consultation.
Ride Protected. Ride Safe, with Bike Legal
FAQs: California Bike Lanes and Bicycle Infrastructure
What are the different types of bike lanes in California?
California classifies bikeways into four types:
- Class I: Off-street paths shared with pedestrians.
- Class II: On-street painted bike lanes.
- Class III: Shared lanes (sharrows) without separation.
- Class IV: Protected bike lanes separated from traffic by barriers.
Why are protected bike lanes the safest for cyclists?
Protected bike lanes physically separate cyclists from vehicle traffic, preventing common collisions like side-swipes and dooring. According to NACTO and PeopleForBikes, cities with protected bike lanes see 44% fewer fatalities for all road users and 50% fewer serious injuries compared to cities without them
What is California doing to improve bicycle infrastructure?
California cities are investing in Vision Zero and Complete Streets initiatives that prioritize cyclist safety. Los Angeles passed Measure HLA (2024), requiring bike and pedestrian improvements during street repaving. San Francisco and San Diego have also adopted Complete Streets policies that include protected bikeways in major projects.
Where are California’s most dangerous streets for cyclists?
High-injury corridors are concentrated in Los Angeles, San Francisco, San Diego, Orange County, and the Central Valley. In L.A., 79% of serious bicycle crashes occur on just 6.6% of streets, often on high-speed arterials without protected lanes.
How does California’s 3-Foot Passing Law protect cyclists?
California’s Three Feet for Safety Act requires drivers to give cyclists at least three feet of clearance when passing. The OmniBike Bill (AB 1909) strengthened this by requiring motorists to change lanes entirely when feasible, providing greater safety on roads without protected infrastructure.
What are the biggest barriers to building better bike lanes?
Common obstacles include limited funding, political resistance to lane reallocation, and complex permitting processes. The 2024–25 state budget also cut $400 million from the Active Transportation Program, slowing new projects despite growing demand for safe cycling routes.
How can residents advocate for more bike lanes in their city?
Cyclists can push for safer streets by contacting city council members, attending public comment sessions, and supporting local ballot measures like Measure HLA. Partnering with advocacy groups such as CalBike, BikeLA, or the San Diego County Bicycle Coalition can also help amplify local efforts.
Bike Legal Spoke & Law Blog


If a Driver Seriously Injures or Kills Someone, Are They Automatically Tested for Drugs and Alcohol?
California’s Landmark Electric Bicycle Safety Study Reveals Why Regulating E-Bikes Is So Complicated
Ride Protected
Ride Safe, with Bike Legal
At Bike Legal, our mission is to advocate for bicycle safety and to share the road responsibly through education. Our legal team is committed to supporting and representing cyclists across the United States, no matter where you ride or how you ride.