Emerging Technologies for Tracking Active Transportation in the United States
Follow us on
social media!
Across the United States, cities and transportation agencies are rethinking how they measure movement on public streets. For generations, traffic monitoring systems were built around motor vehicles. Counters tracked cars, not people. Intersections timed signals based on vehicle delay, not safe crossings. And transportation investments flowed toward the modes that were easiest to measure.
As the nation prioritizes Vision Zero, climate objectives, and walkable communities, that paradigm is shifting. Cycling, walking, and micromobility use have surged, yet reliable data on where people travel, when they travel, and how many are exposed to unsafe conditions remains limited. Without accurate counts, the needs of cyclists and pedestrians are routinely underestimated. The result is a persistent gap between the number of people who rely on active transportation and the level of infrastructure provided to protect them.
New technologies are closing that gap. From AI-powered video analytics to telecom movement data, advanced intersection detection, crowdsourced near-miss reporting, and sub-lane mode classification, agencies now have tools that reveal far more than a car counter ever could. Combined with crash and injury metrics, these systems are reshaping how governments identify unsafe corridors, prioritize investments, and fulfill their duty of care to non-motorists.
This article explores where that technology is headed, what federal agencies recommend, how DOTs and MPOs are adopting new standards, and why better measurement is critical for safer streets. At the core is a simple truth: when cyclists and pedestrians are finally counted, their safety can no longer be ignored.
Table Of Contents
Why Tracking Bicycle and Pedestrian Data Matters
Supporting Vision Zero and Systemic Safety Improvements
Cyclists and pedestrians make up a disproportionate share of serious injuries and traffic deaths often due to common road dangers. Yet many cities still make design decisions without knowing how many people are exposed to risk.
Crash numbers alone cannot reveal danger. Without volume counts, agencies cannot calculate risk, identify fatality rates tied to exposure, or detect corridors where small numbers of crashes mask deeply unsafe conditions.
Modern tools allow agencies to map multimodal demand, find conflict zones, and document near-miss events years before a fatal crash appears in state databases. This aligns with Vision Zero and FHWA’s Safe System approach: design for human safety, not just vehicle flow.
2023 Bicycle and Pedestrian Crash Statistics
- 7,314 pedestrians were killed in U.S. motor-vehicle crashes in 2023
- 68,000 pedestrians were injured
- 1,166 bicyclists were killed (a record high, 4 percent increase from 2022)
- 49,500 bicyclists were injured
- Pedestrian and cyclist fatality risk rose 38 percent over the last decade (per-capita)
These figures highlight the urgent need for systematic data on where people walk and ride, how many are exposed to risk, and which corridors need immediate redesign.
As active transportation use grows, the number of people exposed to injury risk continues to increase, making robust, systematic data collection more urgent than ever.
Using Multimodal Data to Secure Funding for Bicycle and Pedestrian Infrastructure
Many federal safety programs now prioritize investments where agencies can demonstrate bicycle and pedestrian demand, injury risk, and a clear need for safer bicycle and pedestrian infrastructure.
Multimodal counts, origin–destination patterns, and exposure rates help prove that people are present even on corridors long assumed to be “low demand.” This evidence is now essential for justifying bicycle infrastructure, improved crossings, and speed management.
Agencies that measure active transportation have far more leverage to secure funding, build infrastructure, and meet evolving federal standards.
Advancing Equity and Ensuring All Communities Are Counted
For decades, traffic counts have been concentrated in major arterials and high-visibility commercial corridors, locations more likely to receive investment. Meanwhile, neighborhoods with lower resources, higher injury rates, and large populations walking or biking for essential trips often lack formal data collection altogether.
This imbalance creates an equity gap:
If a community is not counted, it is systematically underfunded.
Federal agencies now emphasize data that:
- Includes lower-income neighborhoods
- Captures school routes
- Accounts for people using mobility devices
- Avoids over-reliance on smartphones and app sources
- Reflects ADA travel and non-driver populations
Who Collects Bicycle and Pedestrian Data in the United States?
Responsibility for collecting and analyzing bicycle and pedestrian data is distributed across multiple levels of government and a growing set of partners. Unlike vehicle data, which flows through standardized national systems, active transportation data is still fragmented.
State Departments of Transportation (DOTs)
State DOTs play a central role. Historically, they focused on vehicle counts tied to congestion and performance metrics. Today, many operate permanent non-motorized count stations, run short-duration bike/ped programs, track high-injury networks, and incorporate non-motorist volumes into Highway Safety Improvement Program (HSIP) evaluations.
States like California, Colorado, Minnesota, Utah, Massachusetts, and Oregon have formal multimodal count programs, driven by FHWA guidance, federal funding requirements, climate targets, and legislative mandates.
Metropolitan Planning Organizations (MPOs) and Regional Agencies
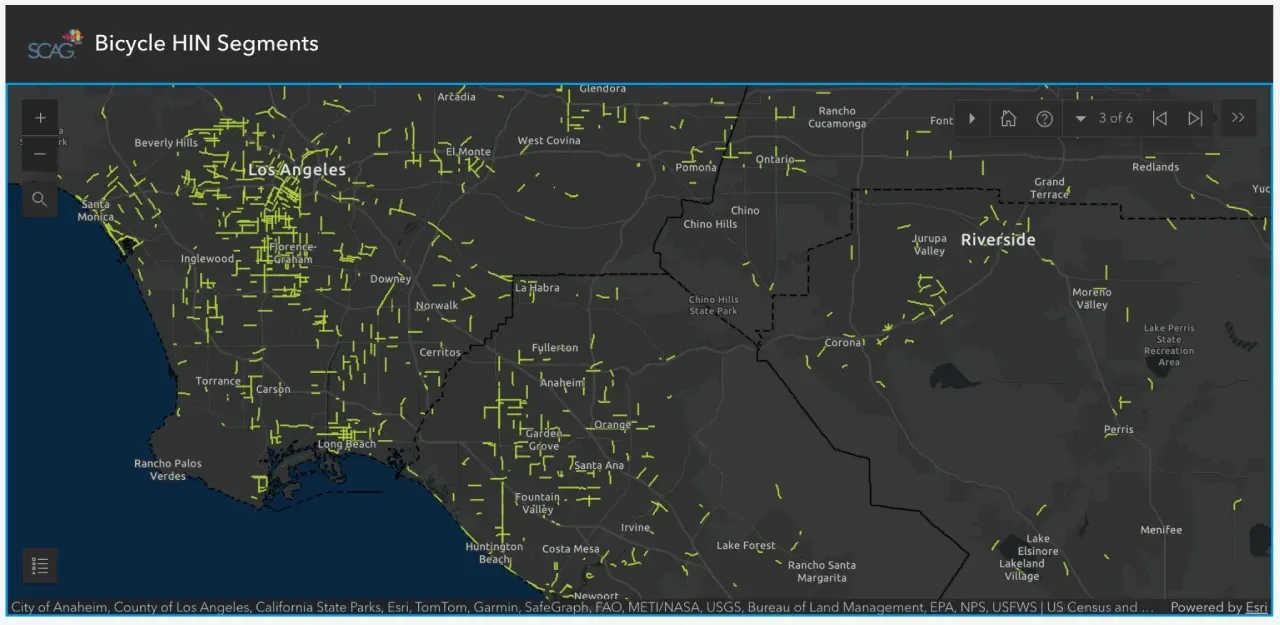
Metropolitan Planning Organizations often maintain the most sophisticated multimodal datasets in their regions. They coordinate federal transportation funding, conduct on-street and trail counts, manage regional crash dashboards, map high-injury networks, and integrate safety outcomes into long-range transportation plans and climate strategies.
MPO data is especially important for Safe Streets for All grant applications, where bike/ped volumes and high-injury maps provide foundational evidence.
Cities, Transit Agencies, and School Districts

Local governments collect data tied to specific projects, Safe Routes to School, Vision Zero initiatives, corridor repaving, and ADA assessments. They measure intersection turning movements by mode, sidewalk and trail use, desire lines through parks and plazas, and patterns around schools, transit hubs, and commercial districts.
Transit agencies increasingly track how many people walk, bike, or roll to stations and stops. School districts contribute baseline counts in communities with strong Safe Routes programs. For cities, these datasets justify investments and help defend them when street redesigns face political pushback.
Universities, Private Mobility Data Providers, and Advocacy Organizations
The most innovative streams of active transportation data often originate outside traditional government structures.
Universities and research institutions develop advanced methods for:
- Computer vision analytics,
- Pedestrian modeling,
- Near-miss identification,
- Crash prediction and spatial risk analysis,
- Multimodal trip behavior research.
Private-sector mobility data providers, including bikeshare systems, scooter companies, GPS fitness platforms, telecom services, and app-based routing companies, offer anonymized trip traces, heatmaps, dwell patterns, surge events, and origin-destination flows.
While such datasets come with limitations and equity caveats, they offer large sample sizes that governments alone would find difficult and expensive to produce.
Advocacy organizations and nonprofits contribute manual counts, near-miss reporting, crash maps, hazard campaigns, and community surveys.
Groups like Transportation Alternatives, Families for Safe Streets, Phoenix Spokes People, Bike Portland, LA Bike Coalition, Calbike, and dozens of others have been early adopters of technology-assisted data collection. Their findings often spotlight safety failures long before a city’s formal crash data reflects the danger.
FHWA Guidelines for Counting Non-Motorists
For decades, federal traffic monitoring guidelines largely focused on motor vehicles, reflecting a system built around measuring congestion and vehicle delay.
As pedestrian and bicycle deaths have risen, and national policy shifts toward safety and mode shift, the Federal Highway Administration (FHWA) has taken a more assertive position: counting non-motorists is a necessary element of modern transportation planning, safety analysis, and federal funding compliance.
Federal Standards for Bicycle and Pedestrian Counts (FHWA Traffic Monitoring Guide)
FHWA’s Traffic Monitoring Guide (TMG) now includes specific direction on non-motorized counts. Agencies are expected to integrate multimodal counting into state monitoring programs, use both permanent and short-duration counts, apply expansion factors for annualization, and ensure methods meet defensible technical standards.
Exposure, Sampling, and Network Coverage Expectations
FHWA emphasizes two basic principles: crash numbers must be paired with exposure data, and counts must be broad enough to reflect how people use the entire network. Single-point counters or occasional special-event counts are not enough. Agencies are encouraged to sample across bike lanes, shared-use paths, suburban and rural corridors, downtowns, school zones, and transit access routes.
Privacy, Data Ethics, and Public Transparency Requirements
FHWA and USDOT emphasize privacy when using camera feeds, GPS traces, or telecom location analytics. Recommended safeguards include automated anonymization, limited retention, transparency about what is collected, and assurance that data will not be used for enforcement. Privacy expectations are especially important in communities with histories of surveillance or over-policing.
Conventional Methods for Collecting Active Transportation Data
Manual Counts and Volunteer Survey Programs
Manual counts use staff or volunteers to tally people walking, biking, or rolling at specific locations and times. They offer high classification accuracy and valuable context but only capture short windows, are vulnerable to weather and event bias, and cannot reflect annual patterns. They are useful for targeted studies but not sufficient for large-scale safety planning or grant support.
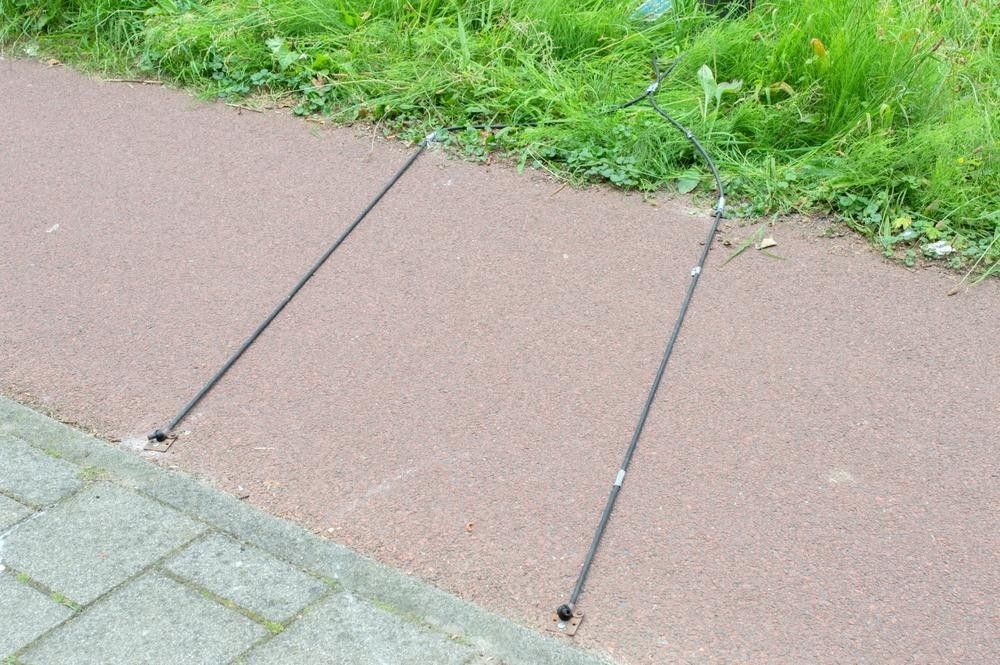
Pneumatic Tubes, Inductive Loops, and Permanent Trail Counters
Vehicle-oriented technology like tubes and loops can be adapted for bicycles, but lighter bikes, scooters, and mobility devices are often missed, and mixed traffic makes classification difficult.
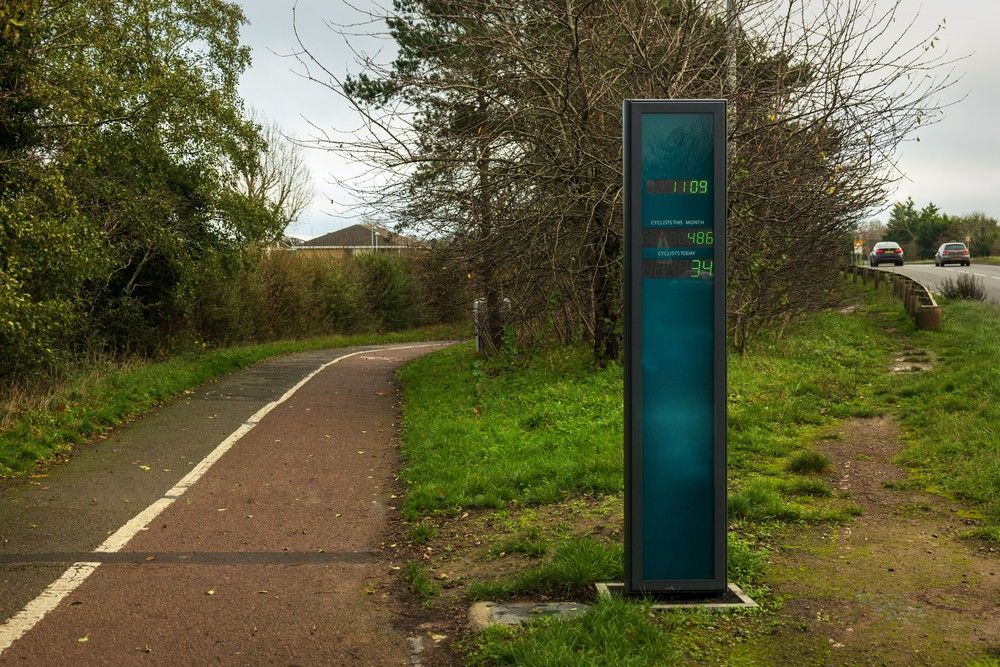
Permanent counters on trails and flagship corridors do provide strong long-term insight daily, weekly, and seasonal trends but they are usually installed where bike and pedestrian activity is already high. Everyday utilitarian routes and high-risk arterials are often left uncounted.
This leaves many high-risk corridors “uncounted” and allows opponents of infrastructure redesigns to argue that demand is low simply because no permanent counter exists.
Limitations of Traditional Bicycle and Pedestrian Data Collection
Traditional methods share core weaknesses:
- short temporal coverage
- poor detection of complex pedestrian and cycling movement
- misclassification of emerging micromobility modes
- geographic bias toward flagship trails
- systemic undercounting that weakens safety justification
These limitations are why agencies are turning to continuous, multi-modal technologies capable of capturing volumes, behavior, conflicts, and risk.
When non-motorists are undercounted, their safety needs appear less urgent.
Emerging Technologies Transforming Active Transportation Data
New tools allow agencies to monitor multimodal travel continuously and at scale, revealing not just how many people travel but how they move and where conflicts occur.
Below are the most transformative systems currently reshaping active transportation data.
AI Video Analytics and Automated Near-Miss Detection
Computer vision tools use mounted cameras and trained machine-learning models to detect and classify movements at intersections, along corridors, and within complex multimodal environments. Unlike traditional counters, which simply record a passing body, modern video analytics can identify:
- Mode type (bike, pedestrian, scooter, wheelchair, stroller),
- Turning movements by direction,
- Driver yielding behavior,
- Encroachment into crosswalks or mobility lanes,
- Vehicle turning conflicts with cyclists,
- Unsafe proximity events, and
- Full near-miss patterns.
These systems are particularly powerful because they reveal risk long before a crash. By highlighting close calls, forcing events, and evasive maneuvers, agencies can uncover dangerous intersections that may not show up in standard crash databases for years.
Importantly, modern video platforms are built to preserve privacy through pixel blurring or real-time anonymization, ensuring the data informs safety policy without capturing identity.
GPS, Telecom, and Fitness App Movement Data
Cyclists and pedestrians now generate large volumes of anonymized trip data through GPS navigation apps, fitness platforms such as Strava or Map My Walk, smartphone telemetry, telecom movement traces, and route-mapping tools used by commuters and recreational riders.
These datasets reveal heatmaps of travel demand, origin–destination flows, time-of-day patterns, mode shifts (for example, car-to-bike or bike-to-transit), and seasonal or regional mobility trends.
While there are equity concerns smartphone-based datasets may underrepresent youth, low-income riders, or undocumented workers they provide sample sizes that manual counts or isolated point sensors cannot match.
When combined with on-the-ground counters and traditional field observations, they help agencies see a much fuller multimodal picture of how people actually move through a region.
Crowdsourced Hazard Reports and Near-Miss Mapping Tools
Platforms like Street Story and BikeMaps let riders and walkers report near-misses, aggressive driving, failure-to-yield, and locations that feel unsafe. This information captures incidents police reports never document and reflects the lived experience of people who use the corridor daily. Integrated with GIS tools, these platforms help planners focus on problem areas early.
Micromobility Fleet Data from Bikeshare and Scooter Systems
Bikeshare systems and e-scooter companies produce rich, anonymized trip data that shows where people ride, connect to transit, and park. This helps cities identify demand for protected lanes, corrals, and safer connections in places without traditional counters, especially where e-bike and scooter use is growing quickly.
Bluetooth and Wi-Fi Sensors for Pedestrian Flow Monitoring
Anonymous device detection systems can estimate pedestrian flows by counting the presence of Bluetooth or Wi-Fi signals. These tools do not record identities or personal information; they simply detect signal presence to estimate movement volumes over time.
Unlike permanent counters that capture only a single lane or path, device-based systems can measure movement across entire blocks, plazas, or multimodal street segments.
Radar, Lidar, and Thermal Detection for Signalized Intersections
Advanced sensors originally designed for vehicle detection are now being adapted to detect cyclists in mixed-lane environments, identify pedestrians in low-light conditions, distinguish modes by shape and movement, and trigger signal timing based on real-time demand.
These systems generate high-accuracy logs that can serve as reliable bicycle and pedestrian count datasets, making them especially valuable for analyzing turning conflicts, crossing delays, yielding behavior, and time-of-day patterns involving vulnerable road users.
Smart Signals, Mast-Arm Cameras, and Automated Crosswalk Sensors
Many agencies are updating intersections with “smart” infrastructure designed to alert signals when a non-motorist is present. The data captured by these systems does far more than time a light. It provides continuous volume counts and time-stamped presence logs that show exactly when and where people walk, bike, or roll.
As these technologies are deployed, signal cabinets themselves become multimodal data sources.
Connected Vehicle (CAV) and V2X Multimodal Detection
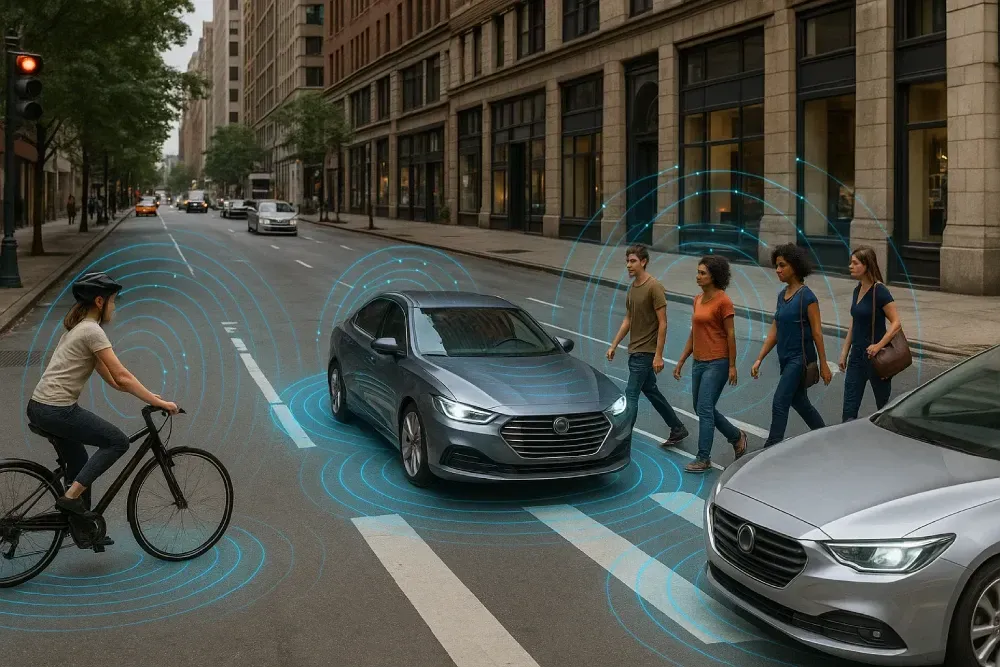
As connected-vehicle systems evolve, they can detect cyclists and pedestrians using roadside units and wireless communication. Future networks may use near-miss logs and fleet telematics to model systemic risk rather than waiting for crash history.
The long-term vision is a “whole-street dataset” in which every user type is measured through shared, connected systems.
Integrated Data Platforms and Digital Twin Network Modeling

One of the most significant recent developments is not any single technology, but the integration of multiple datasets into unified, cloud-based platforms. These systems merge crash data, bike and pedestrian counts, GPS trip traces, intersection detection logs, signal timing information, equity layers, and design scenarios into a single analytical environment.
The result is a “digital twin” of a corridor or entire street network, allowing planners to test design changes, evaluate safety impacts, and forecast mode shifts long before construction begins. For agencies pursuing Vision Zero, climate targets, or micromobility policy goals, these integrated modeling tools are quickly becoming essential.
Why Counting Cyclists and Pedestrians Requires Different Methods Than Cars
Vehicle-oriented tools were built for predictable lane movements, consistent vehicle size and weight, and clearly defined roadways. People move differently.
Active transportation covers a wide range of modes such as bikes and e-bikes, scooters, wheelchairs, strollers, cargo bikes, joggers, and more, which are hard for traditional sensors to detect or classify. Walking and biking volumes are more sensitive to weather, daylight, school schedules, and events, so short counts are easy to misinterpret.
People also use informal paths, cut-throughs, parks, campuses, and shared streets that fall outside standard roadway monitoring systems. Smartphone-based data often underrepresents children, older adults, lower-income residents, and undocumented workers.
Corridors where active travel is a necessity, may look “low demand” on paper and remain dangerous due to lack of investment.
These differences are exactly why counting cyclists and pedestrians requires new tools, new sampling strategies, and a strong equity lens.
Challenges Agencies Face in Adopting New Multimodal Data Technologies
Funding Gaps, Staffing Constraints, and Technical Expertise
Running modern programs requires hardware, software, maintenance, data science skills, GIS capacity, expansion factors, and integration with crash databases. Many agencies lack staff or rely on consultants, creating sustainability challenges.
Interoperability, Procurement Barriers, and Vendor Lock-In
Interoperability and vendor lock-in are real concerns. Some systems rely on proprietary sensors or data formats that do not integrate well with existing traffic systems or federal reporting. Procurement rules can slow experimentation and make it difficult to compare tools.
Privacy Concerns and Community Trust
Privacy and community trust also matter. Camera and telecom-based tools raise surveillance concerns, especially in communities with histories of over-policing. Agencies must be clear about what they are measuring, how long they store data, and how it will be used.
Privacy is not a barrier to adoption, but a requirement for ethical deployment. Agencies that communicate clearly tend to see far greater public acceptance and cooperation.
Institutional Resistance to Vehicle-First Performance Metrics
Many agencies still operate under decades-old performance frameworks that prioritize vehicle speed, roadway throughput, and Level of Service (LOS).
Barriers often include:
- internal culture that devalues walking or biking as legitimate transportation modes,
- reluctance to redesign corridors that reduce vehicle capacity,
- pressure from elected officials who fear backlash over lane conversions (road diets)
These legacy attitudes slow adoption even when technology is affordable and widely available.
Disconnect Between Crash Reports, Hospital Records, and Exposure Data
Police reports often misclassify or omit bicycle and pedestrian incidents, while hospitals hold injury data that is rarely integrated with transportation analysis. Without paired crash, injury, and exposure data, risk calculation and safety prioritization remain incomplete.
How Active Transportation Data Is Used to Improve Safety
Identifying High-Use and High-Injury Networks
The most powerful application of multimodal data is the overlay of two critical layers:
- Where people walk, bike, or use mobility devices, and
- Where crashes or near-miss patterns are concentrated.
These combined datasets reveal “high-injury networks,” where collisions are not random, but the predictable result of traffic speed, street geometry, and user exposure.
High-injury network maps are now central to Vision Zero strategies, FHWA’s Safe System approach, Safe Streets for All grant submissions, and local capital improvement plans.
Policies like Measure HLA in Los Angeles now use high-injury network data to determine where required safety upgrades must be installed during routine repaving
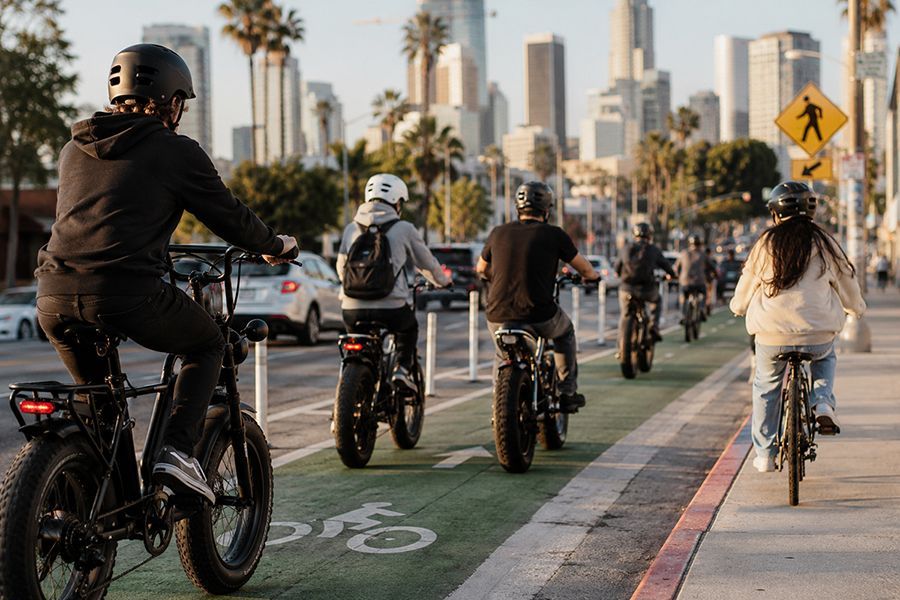
Designing Protected Bike Lanes, Safer Crossings, and Traffic Calming Projects
Mode counts and conflict logs help engineers match treatments to real-world conditions, from protected bike lanes and raised crosswalks to median refuges, separated micromobility facilities, and protected signal phases.
National data consistently shows that when safer bicycle and pedestrian infrastructure is installed, active transportation increases.
Data-backed redesigns also help address the ongoing bicycle lane debate over whether motorists should share the road
Predictive Safety Modeling for Crash Prevention
Modern safety tools allow engineers to identify intersections that are likely to produce serious crashes in the future instead of waiting for fatality reports. These predictive models align directly with FHWA’s Safe System philosophy: design streets to prevent severe outcomes even when human error occurs.
Enhancing Federal Grant Applications and Policy Decisions
Many federal programs now require data-driven justification for safety improvements. Multimodal counts and risk analyses support submissions for SS4A, HSIP, CMAQ, RAISE, Complete Streets planning, ADA accessibility work, and Safe Routes to School upgrades.
These datasets also reveal latent demand, proving that more people would walk or bike if safer facilities existed.
Using Exposure Data in Bicycle and Pedestrian Injury Litigation
Bicycle and pedestrian data also matters in legal contexts. When strong datasets exist, they can demonstrate that a government:
- knew a corridor carried heavy non-motorized travel,
- understood documented injury or near-miss patterns,
- recognized risk under federal guidance, and
- failed to act with reasonable safety measures.
Combined with engineering standards and crash records, multimodal data helps demonstrate that an injury or death was not an unpredictable event, but a foreseeable outcome of unsafe design.
For cyclists involved in a crash, understanding the steps to take immediately afterward is equally important — our What to Do After a Bicycle Accident Checklist offers clear, practical guidance.
The Future of Active Transportation Monitoring in the United States
As cyclist and pedestrian injuries continue to rise, multimodal data is becoming central to transportation governance. FHWA guidance is evolving into formal count requirements, with states likely to maintain permanent monitoring sites, generate annual exposure estimates, and use sensor-equipped intersections and transit hubs as continuous data sources.
Future systems will combine crash records, telecom movement traces, detection logs, and land-use context into unified platforms, supporting predictive analytics and digital-twin modeling that tests designs virtually. Monitoring frameworks will also need to adapt to micromobility growth, cargo bikes, and connected or automated vehicles while meeting equity and privacy expectations.
This shift marks the end of an era when pedestrian and bicycle travel was largely invisible. New technologies finally allow agencies to measure how people move. When paired with crash history and speed analysis, multimodal data reveals where risk is concentrated and how to correct it. High-injury networks can be defined, protected facilities justified, and equity gaps measured and addressed.
If you build and maintain public roads, you must measure how people use them—not just how vehicles move through them. As multimodal monitoring expands, the question is no longer whether cities should build safer streets, but how quickly they can deliver them.
When people are counted, their safety becomes non-negotiable.
Need Legal Support After a Bicycle Crash? Bike Legal is Here for You
At Bike Legal, we believe every cyclist and pedestrian deserves safe streets. If you were injured in a bicycle crash, our team of bicycle accident attorneys can help you understand your rights, evaluate your case, and pursue the compensation you deserve.
Not sure whether you have a claim? Consultations are always free, and our team will provide honest guidance tailored to your situation.
You don’t have to take our word for it — read our Google Reviews to see what clients say about our service, communication, and results.
📞 Call 877-BIKE LEGAL (877-245-3534) for a free consultation with an experienced bicycle attorney
If you want to learn why choosing a bicycle accident attorney matters, read our in-depth guide: Why You Need a Bicycle Accident Attorney After a Bike Crash
Frequently Asked Qustions (FAQ’s)
Why is collecting bicycle and pedestrian data important?
Accurate multimodal data helps agencies understand where people walk, bike, and use mobility devices, and where they are most at risk. When planners know how many cyclists and pedestrians travel through a corridor, and how often near-misses or crashes occur, they can target safety improvements, justify protected bike lanes, and prioritize funding for high-injury networks.
Who collects bicycle and pedestrian data in the United States?
Most multimodal data is collected by state Departments of Transportation (DOTs), Metropolitan Planning Organizations (MPOs), local traffic engineering departments, universities, advocacy groups, and private mobility partners. Many state DOTs now operate permanent count stations and formal programs aligned with FHWA guidance.
What is the FHWA Traffic Monitoring Guide and how does it relate to active transportation?
The Federal Highway Administration’s Traffic Monitoring Guide (TMG) sets national standards for traffic data collection. Recent editions include detailed chapters on bicycle and pedestrian counting. The guide encourages agencies to collect non-motorist volumes consistently, use permanent and short-duration counts, apply expansion factors, and integrate data into federal reporting.
What types of technology are used to count cyclists and pedestrians?
Agencies use a mix of traditional and emerging technologies. Modern tools include AI-based video analytics, GPS-based movement data, telecom location traces, intersection detection systems, Bluetooth and Wi-Fi signal monitoring, smart signals, radar and lidar sensors, and digital-twin modeling platforms. These systems can measure mode type, conflict patterns, turning movements, and overall volume trends.
How is counting cyclists and pedestrians different from counting cars?
Non-motorists use more diverse modes, travel on informal paths, and make complex movements that vehicle-based tools cannot easily detect. Unlike cars, people on foot or bike may travel across plazas, shared streets, transit hubs, campuses, and trails. Because traditional vehicle counters often miss or misclassify these trips, agencies need multimodal detection systems designed specifically for non-motorists.
How do agencies use bicycle and pedestrian data to improve safety?
Transportation planners use multimodal counts to prioritize safety projects, justify protected facilities, choose appropriate design treatments, evaluate before/after results, and apply for federal grants. Near-miss analysis and conflict logs help agencies see where turning movements, encroachment, and unsafe passing occur so improvements can be targeted in the right locations.
What challenges do DOTs face when adopting new multimodal data tools?
Common barriers include budget limits, lack of staff expertise, privacy concerns, procurement restrictions, fragmented datasets, and legacy performance metrics that still prioritize vehicle speed. Agencies also struggle with data equity because smartphone-based telemetry can undercount low-income travelers, youth, and older residents who bike and walk the most.
How is multimodal data used in bicycle crash or pedestrian injury lawsuits?
Strong bicycle and pedestrian datasets can help show that a city knew a corridor carried high non-motorist traffic, had documented injury patterns, or failed to respond to known risks. In negligence and liability cases, multimodal data helps establish foreseeability, roadway design failures, and whether agencies ignored federal or engineering guidance on safety.
Is multimodal data tied to surveillance or personal identification?
Modern counting technologies are not designed to identify individuals. Most systems anonymize inputs through pixel blurring, signal hashing, or removal of personally identifiable information. FHWA recommends full transparency about what data is collected, how long it is stored, and how it will be used. The purpose is safety and planning, not enforcement.
How will active transportation data evolve in the future?
The future will include standardized national count requirements, permanent multimodal monitoring sites, sensor-embedded intersections, automated crosswalk detection, real-time conflict analysis, and digital-twin simulations that allow agencies to test safety designs before construction. These systems will also need to track emerging mobility types and meet strict equity and privacy expectations.
Bike Legal Spoke & Law Blog

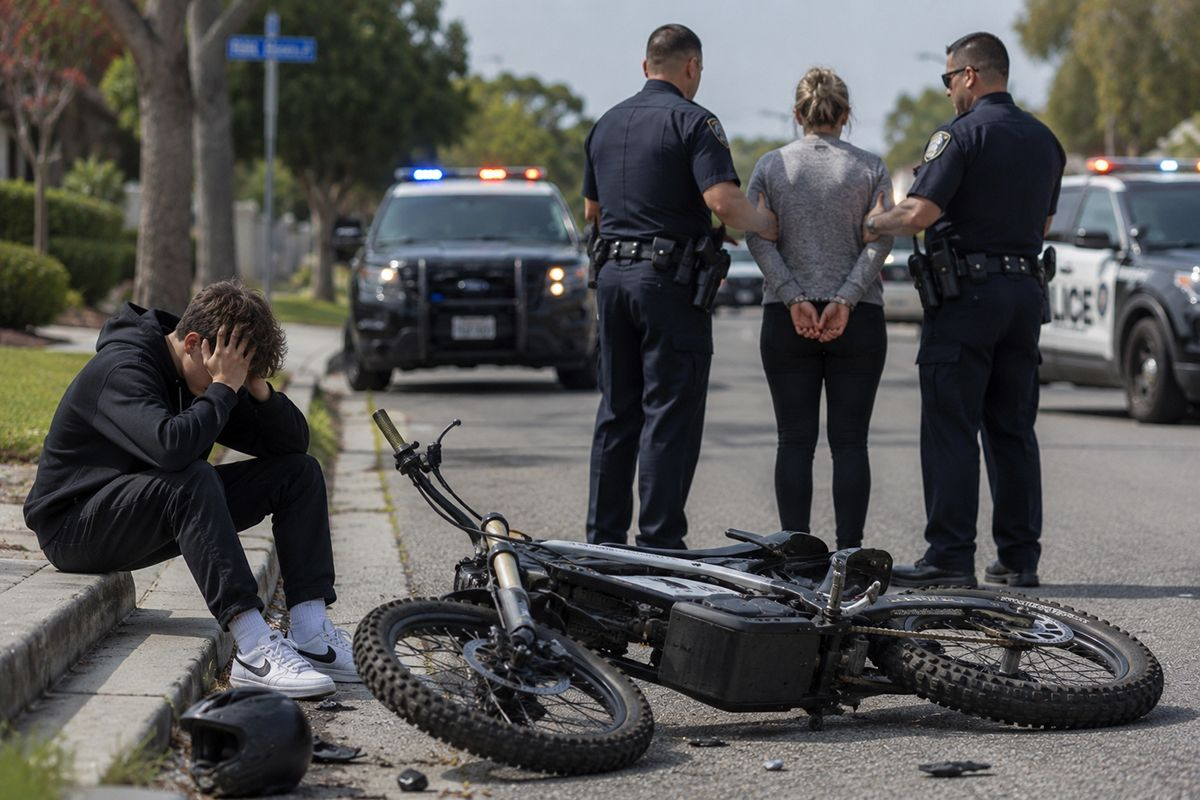
If a Driver Seriously Injures or Kills Someone, Are They Automatically Tested for Drugs and Alcohol?
California’s Landmark Electric Bicycle Safety Study Reveals Why Regulating E-Bikes Is So Complicated
Ride Protected
Ride Safe, with Bike Legal
At Bike Legal, our mission is to advocate for bicycle safety and to share the road responsibly through education. Our legal team is committed to supporting and representing cyclists across the United States, no matter where you ride or how you ride.